
Reading Your Pursuit Reports
See your pipeline by phase and value, your win rate, team workload, match scores, deadlines, and top categories on one page.
Pursuit reports turns your pipeline into charts. Use it to see where your pursuits stand, how much they are worth, who owns them, and which deadlines come next. This guide explains each chart and the numbers behind it.
Or just ask CLEATUS
How many pursuits in my pipeline are due in the next 30 days?
The agent also counts and lists pursuits by phase, assignee, or due date.
Before you start:
The reports show the pursuits on your pipeline, so add a few contracts first. See Adding a Contract to Your Pipeline.
Open Pursuit reports
Open Pipeline > Reports in the sidebar. You can also click All Reports on the Pursuit Pipeline card on your dashboard home.
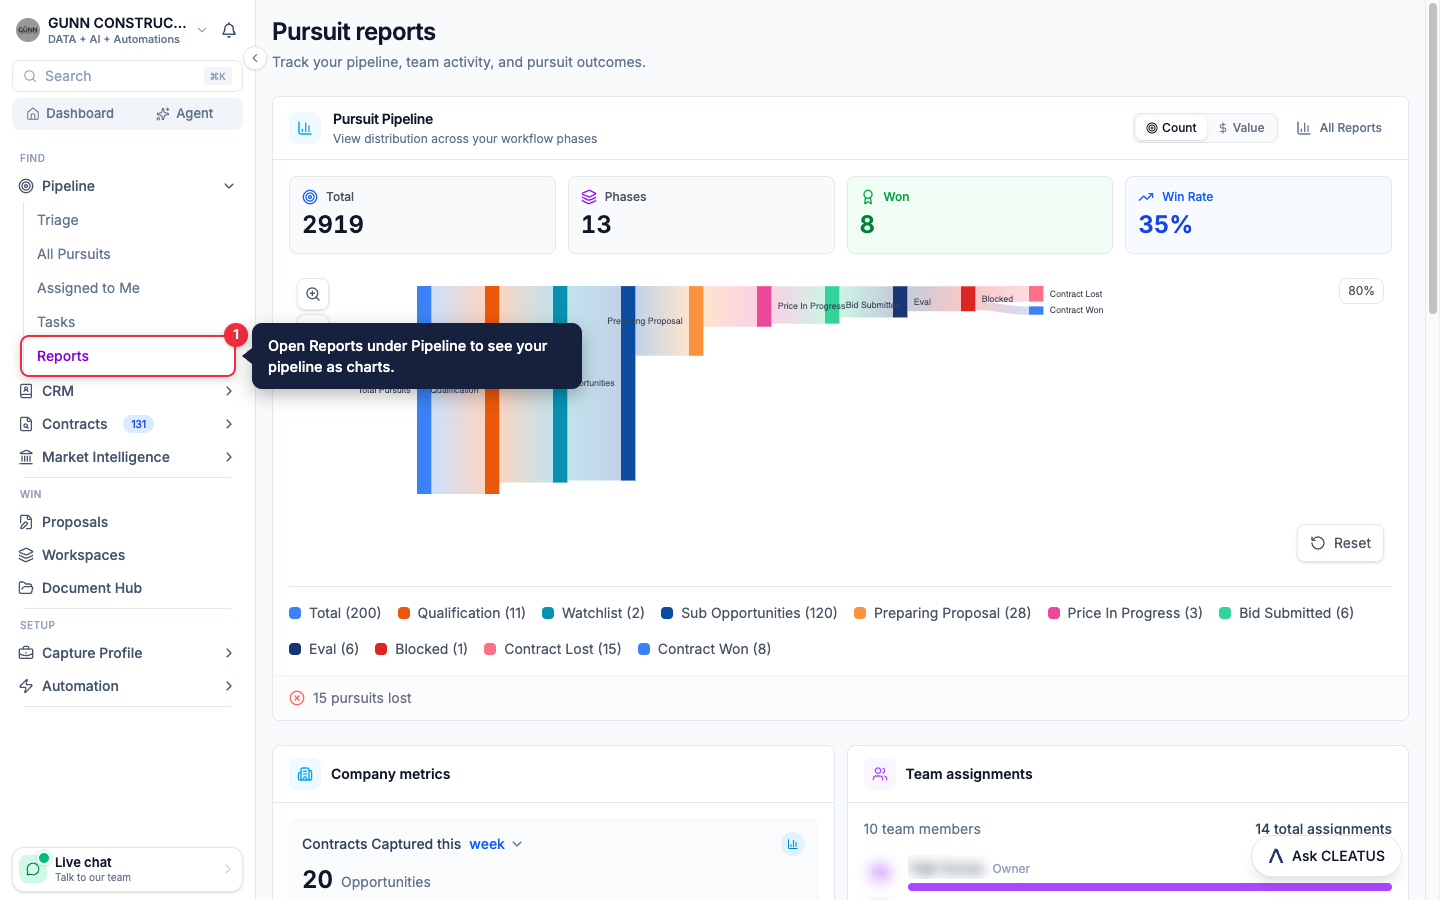
The page has no filters and no date range. Two controls change what a chart shows: Count and Value on the Pursuit Pipeline chart, and week and month on Company metrics. No chart or pursuit count on the page includes archived pursuits.
Read each chart
Pursuit Pipeline
This chart runs across the top of the page. It shows how your pursuits flow from Total Pursuits through each phase to Won and Lost. The flow leaves out Triage, and it shows only the phases that hold pursuits.
- Click Count to see the number of pursuits in each phase.
- Click Value to see the estimated dollar value in each phase. CLEATUS uses the high estimate of each pursuit, or the low estimate when there is no high one. A value that you corrected with Ask CLEATUS or the Update Pursuit workflow action replaces the original. Value stays off until at least one pursuit outside Triage has an estimated value.
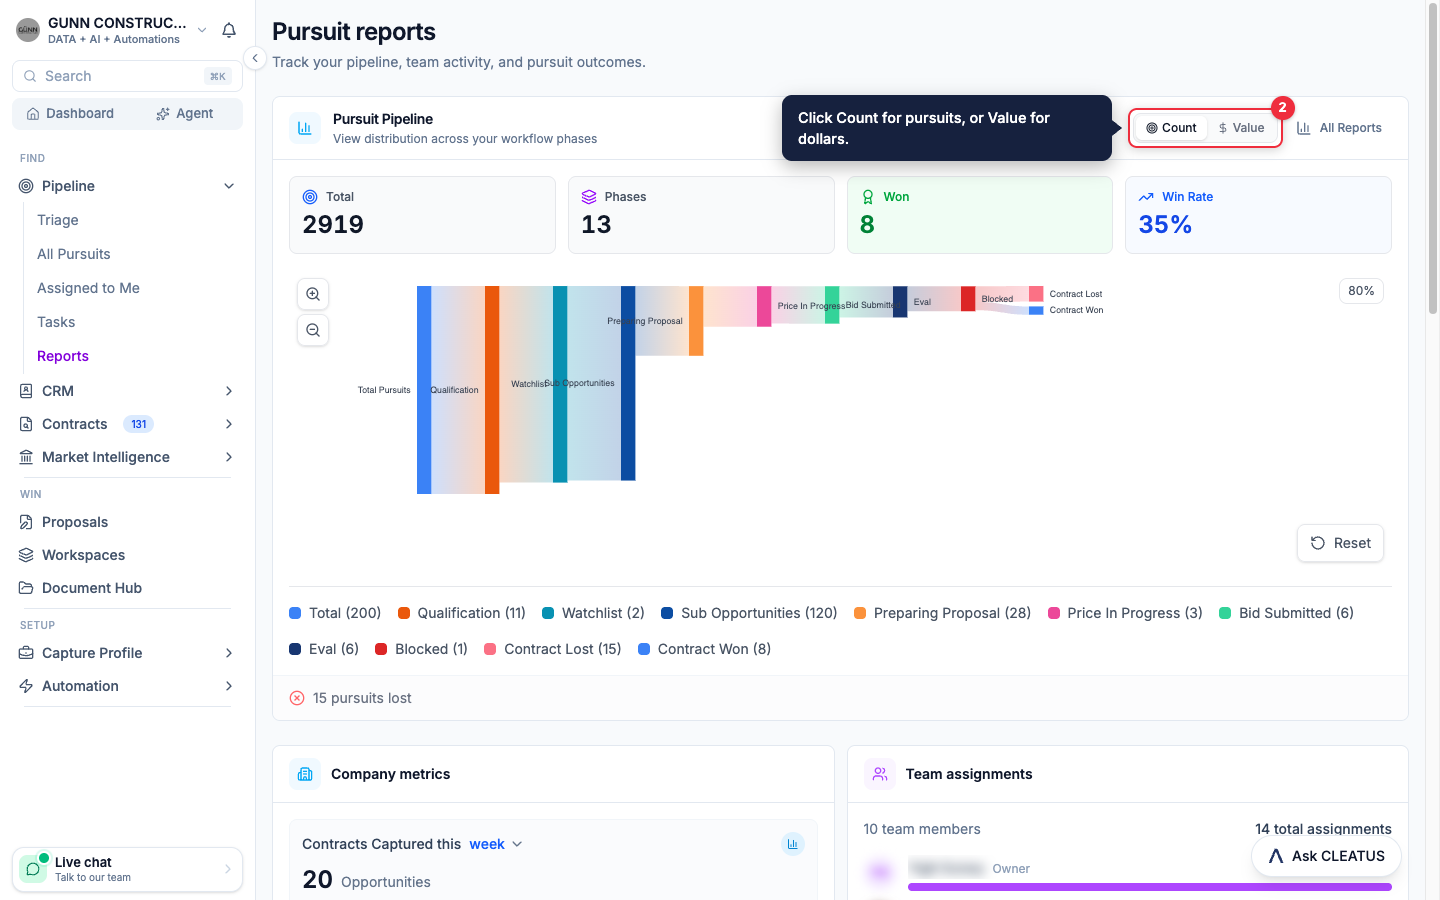
The tiles above the chart show Total, Phases, Won, and Win Rate. Total counts every pursuit that is not archived, Triage included. Win Rate is the number of won pursuits divided by the number of won and lost pursuits.
The default Won and Lost phases count toward the win rate, even after you rename them. A phase that you add counts as won when its name includes "Won" or "Awarded." It counts as lost when its name includes "Lost," "Unsuccessful," "Unawarded," "No Award," or "Not Awarded." If your board has only one of the two, a tile tells you which phase to add.
Company metrics
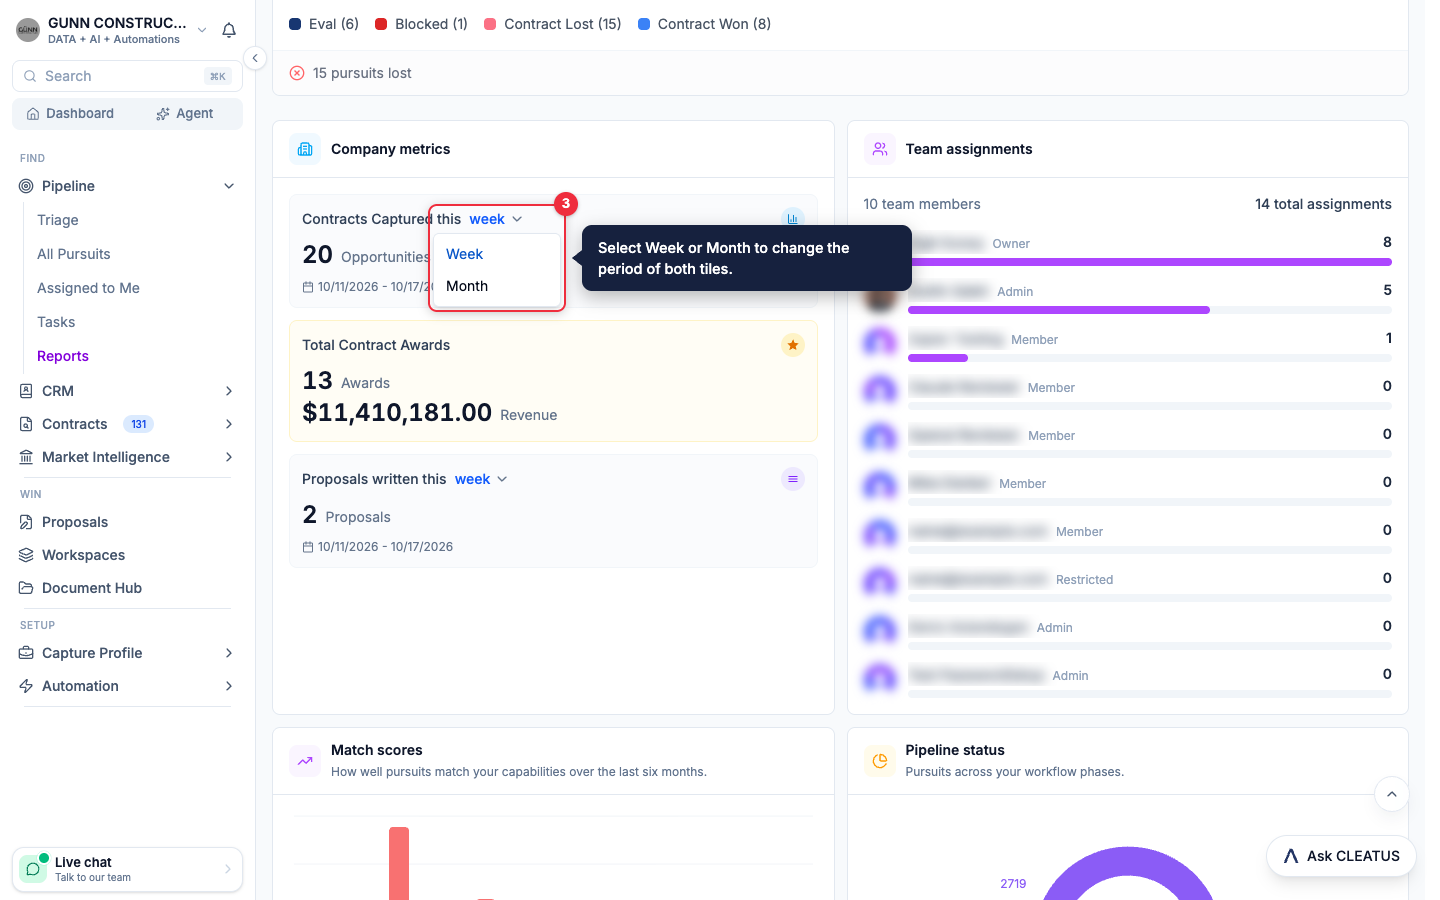
This card has three tiles: Contracts Captured this week, Total Contract Awards, and Proposals written this week.
- Contracts Captured shows the number of pursuits that your team added in the period.
- Total Contract Awards shows the number of contract awards that your company holds, and their total value as Revenue. CLEATUS builds this list from public federal award records for your company, plus any awards that you added by hand.
- Proposals written shows the number of pursuits that got a proposal in the proposal writer in the period. A pursuit counts once, on the date of its newest proposal. Deleted proposals do not count.
To change the period, click week in the title of Contracts Captured or Proposals written, then select Month. The setting changes both tiles. A week runs from Sunday to Saturday, and a month is the calendar month. Both tiles show the date range that they cover.
Team assignments
This card lists each member of your team, with a bar for the number of pursuits assigned to them. Your name shows first, marked (You). The other members follow, most assignments first. Each name shows the role of that member. The top of the card shows the number of members and the total number of assignments.
The card counts the pursuits that are assigned to each member directly. A pursuit that you assign to a team does not add to the count of each team member.
Match scores
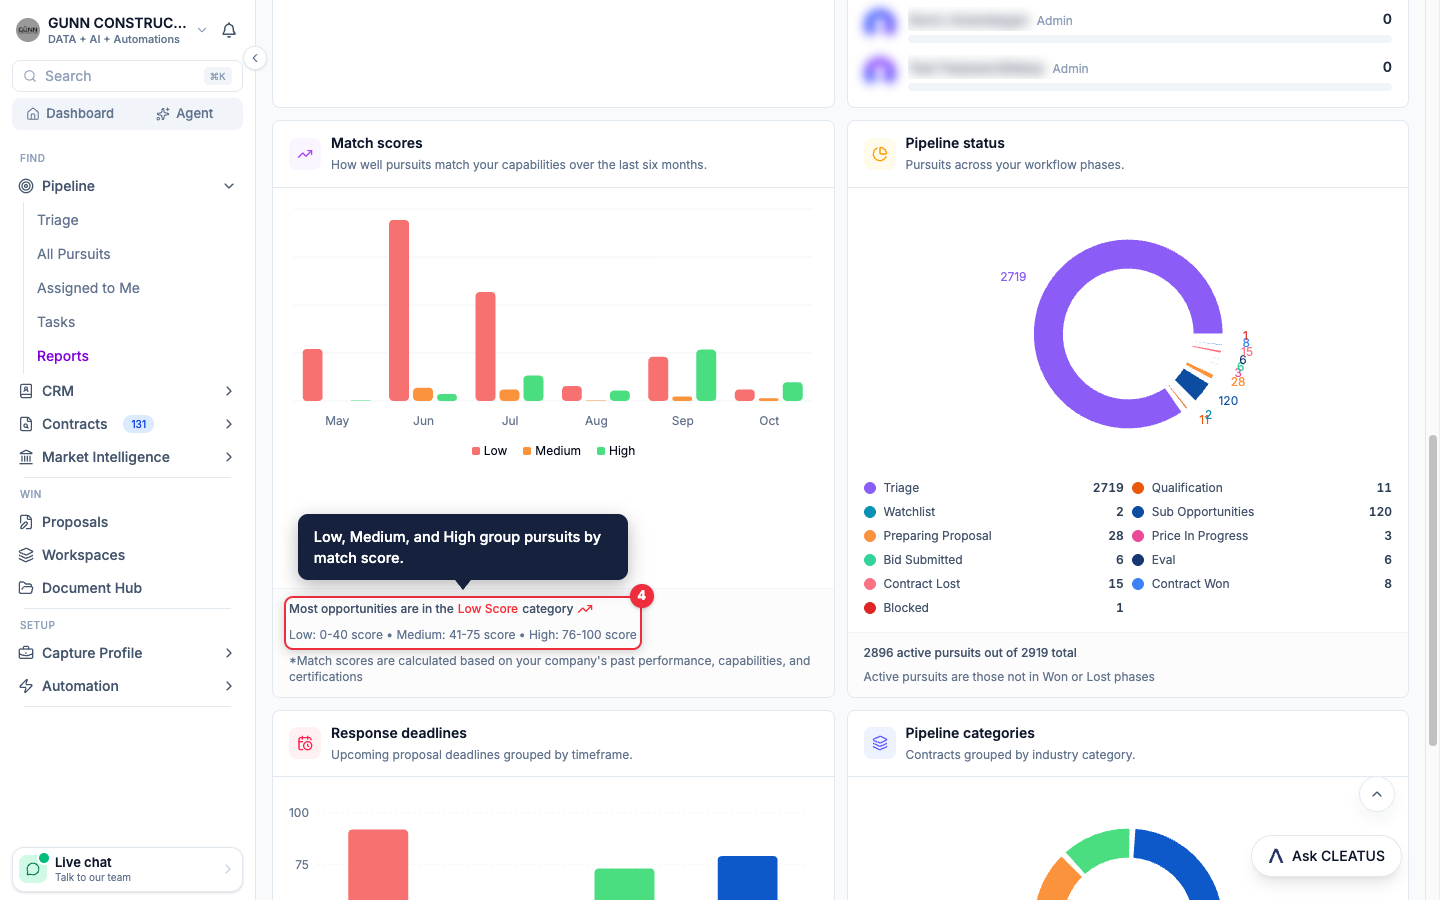
This bar chart groups your pursuits by match score, for the current month and the five months before it. The month is the month that you added the pursuit.
- Low: a score from 0 to 40.
- Medium: a score from 41 to 75.
- High: a score from 76 to 100.
The match score shows how well a contract fits your company, based on your past performance, capabilities, and certifications. Pursuits without a match score, such as work that you added with New pursuit, do not show. The text below the chart names the category that holds the most pursuits.
Pipeline status
This donut chart shows the current number of pursuits in each phase, Triage included. Each slice shows its count. The legend below the chart lists each phase with its count. Point to a slice to see the same details. The text below the chart shows how many pursuits are active. An active pursuit is in any phase except Won and Lost.
Response deadlines
This bar chart groups your upcoming deadlines into four ranges: < 7 days, 7-14 days, 15-30 days, and 30+ days. It counts only pursuits with a deadline in the future. The text below the chart shows how many pursuits are due within 7 days.
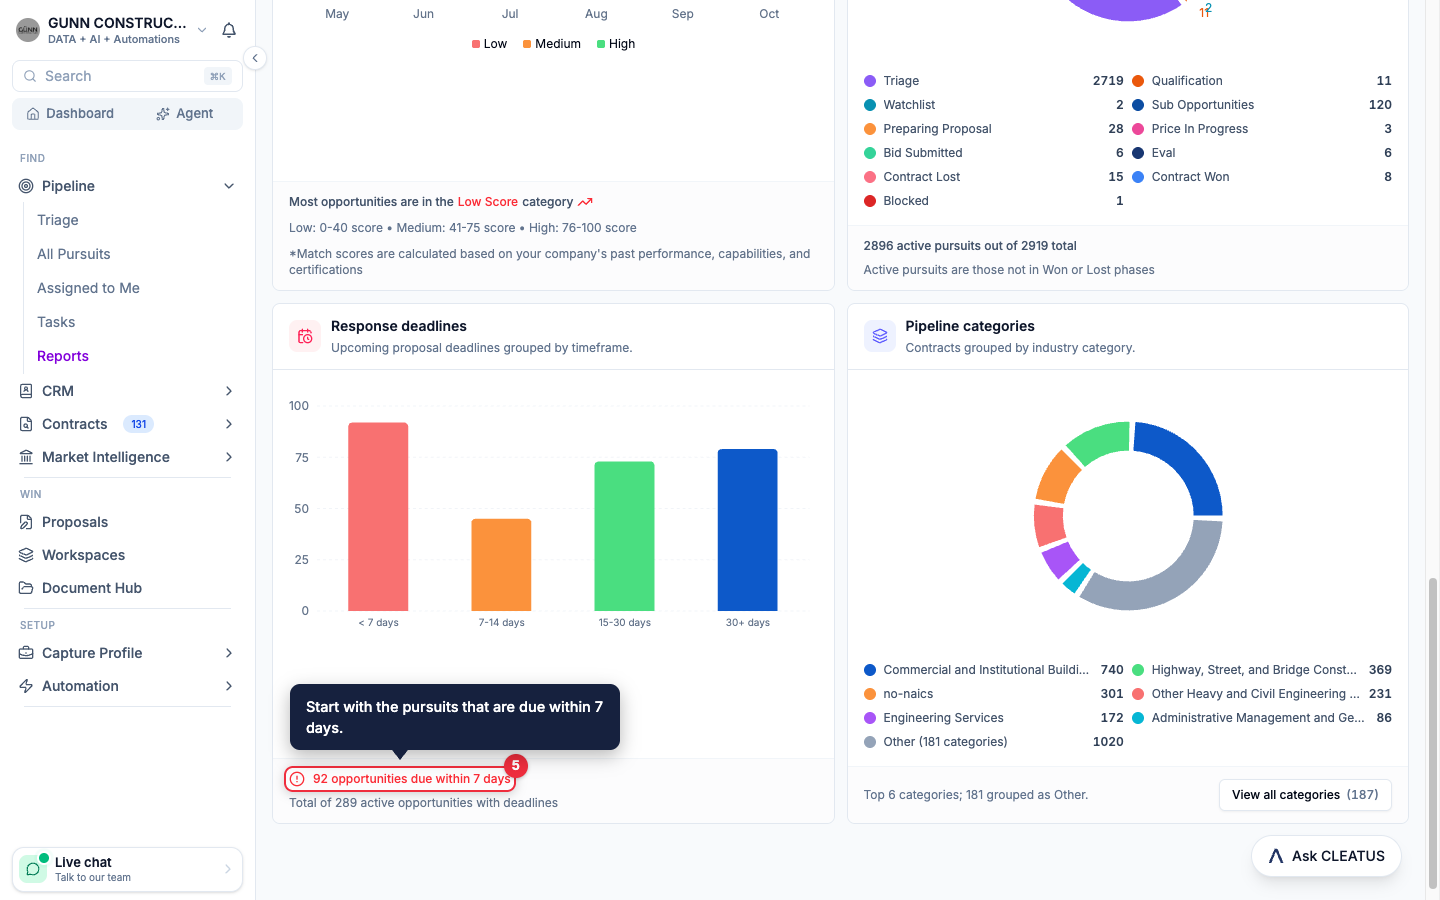
Pipeline categories
This donut chart groups your pursuits by industry category. Each category is a North American Industry Classification System (NAICS) code. Use it to see which lines of business your team pursues most.
The chart shows the six largest categories and groups the rest as Other. Click View all categories to see every category, ordered by the number of pursuits. Search the list by category name or code.
What Limited Members see
A user with the Limited Member role sees the same page, with these differences:
- The charts count only the pursuits that are assigned to that user. So do the Contracts Captured and Proposals written tiles.
- The Team assignments card does not show.
- A Limited Member with no assigned pursuits sees no pursuits in the charts and tiles.
- Total Contract Awards shows the awards of the whole company.
See Adding Users for what each role can do.
Reports on plans without the pipeline
On the Free, Contract Alerts, and DATA plans, Triage, All Pursuits, Assigned to Me, and Tasks are locked. Reports stays open. It shows the pursuits that your company already has.
On the Free and Contract Alerts plans, Reports shows in the Analytics section of the sidebar. It shows only when your company has at least one pursuit. To open and work on your pursuits, upgrade your plan. See Plans and pricing.
Tip:
The win rate is only as good as your board. When an award comes out, move the pursuit to Won or Lost. The Award Tracker workflow template tells you when a contract that you track is awarded.